library(reticulate)Combining Python and R
If you’d like to have Python and R actually interact, you’ll need to make a couple changes.
Setup
First, you’ll add engine: knitr to your yaml config section.
---
title: "Combining Python and R"
engine: knitr
---
Second, we’ll use R’s reticulate library to connect the two languages.
Usage
Import the data using pandas…
import pandas as pd

df = pd.read_csv("temperatures.csv", parse_dates=['Date'])
df.head()
Date Anomaly
0 1880-01-01 -0.30
1 1880-02-01 -0.21
2 1880-03-01 -0.18
3 1880-04-01 -0.27
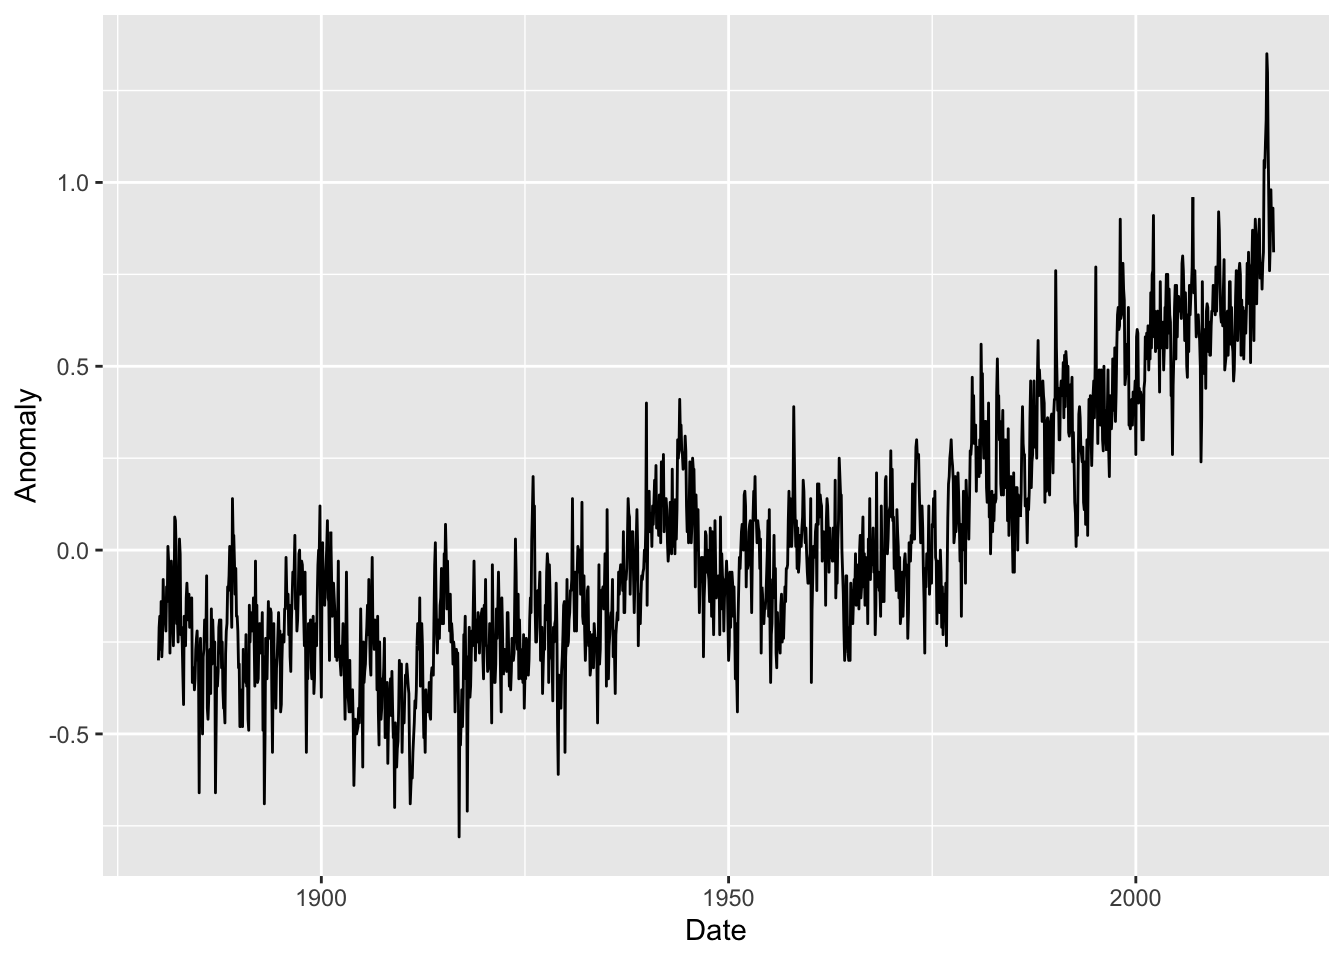
4 1880-05-01 -0.14…and graph it using ggplot.
library(ggplot2)

ggplot(py$df,aes(Date, Anomaly, group=1)) +
    geom_line()