Guides: build the grid from evidence
extract_table() on a scan has nothing to work with — OCR gives you words, but the ruling lines are just dark pixels. Guides make the grid explicit: you build the column and row boundaries from whatever evidence exists, look at them, and only then extract.
The document is the scanned inspection report from the OCR page. OCR it and anchor the table region, same as there:
from natural_pdf import PDF
scan = PDF("pdfs/needs-ocr.pdf")spage = scan.pages[0]spage.apply_ocr()
table_area = (    spage    .find('text:contains("Violations")')    .below(until='text:contains("Jungle Health")', include_endpoint=False)    .trim())table_area.show(crop=True)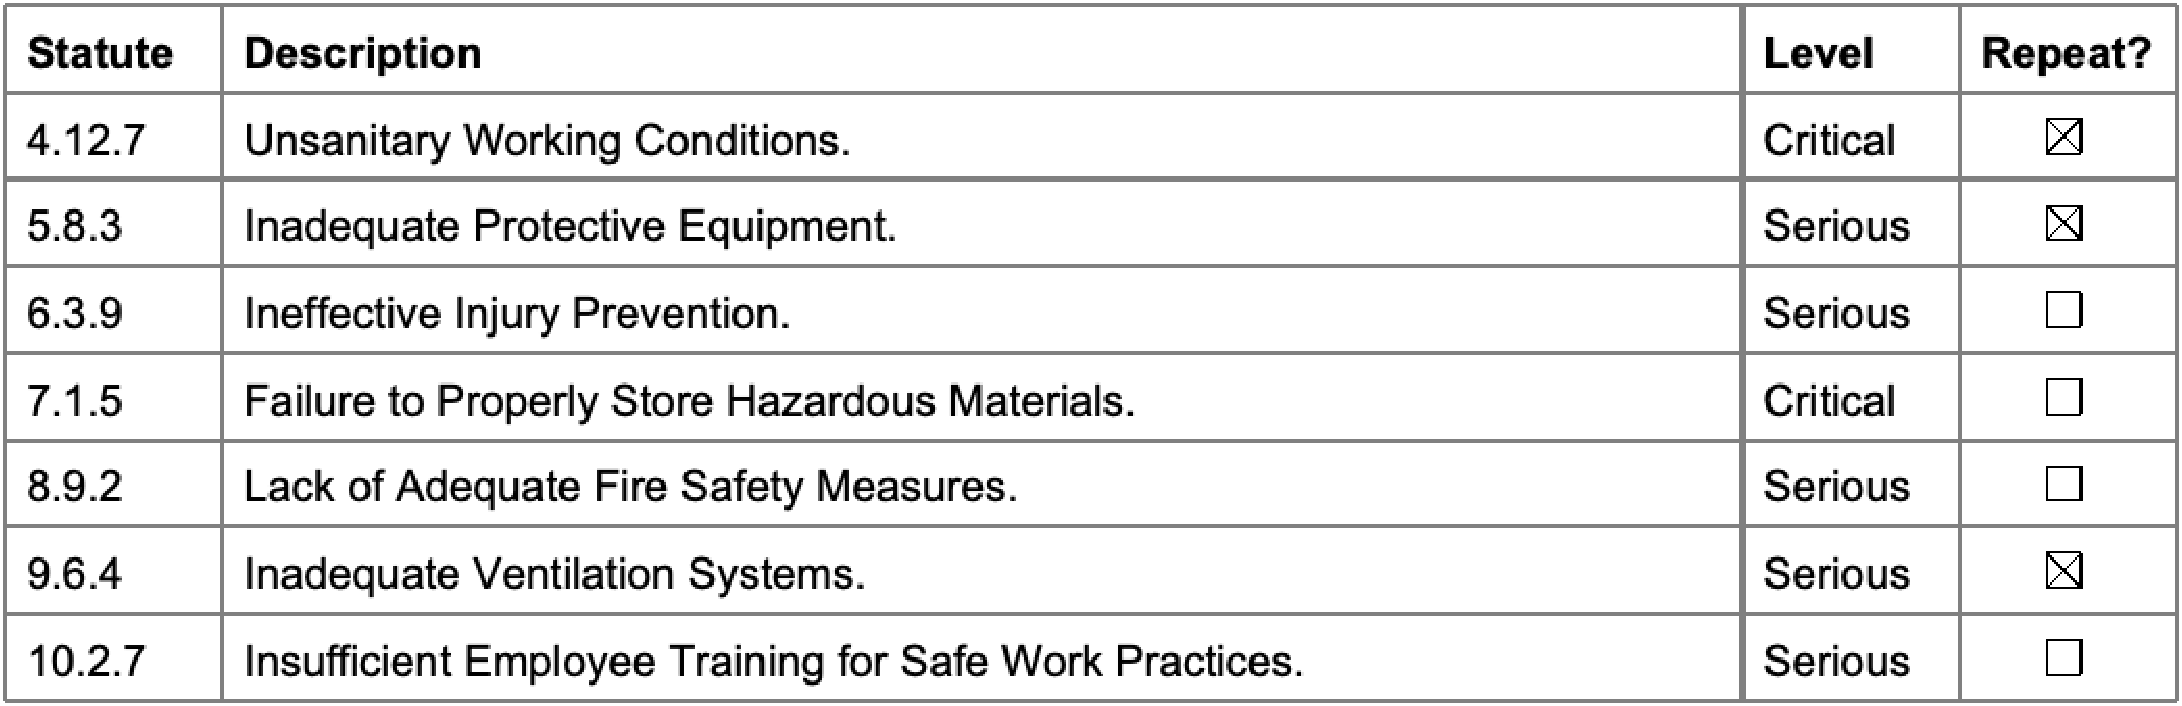
Columns from the headers. The header words are evenly spread, one per column — tell the guides to split there:
guides = table_area.guides()guides.vertical.from_headers(["Statute", "Description", "Level", "Repeat?"])guides.show()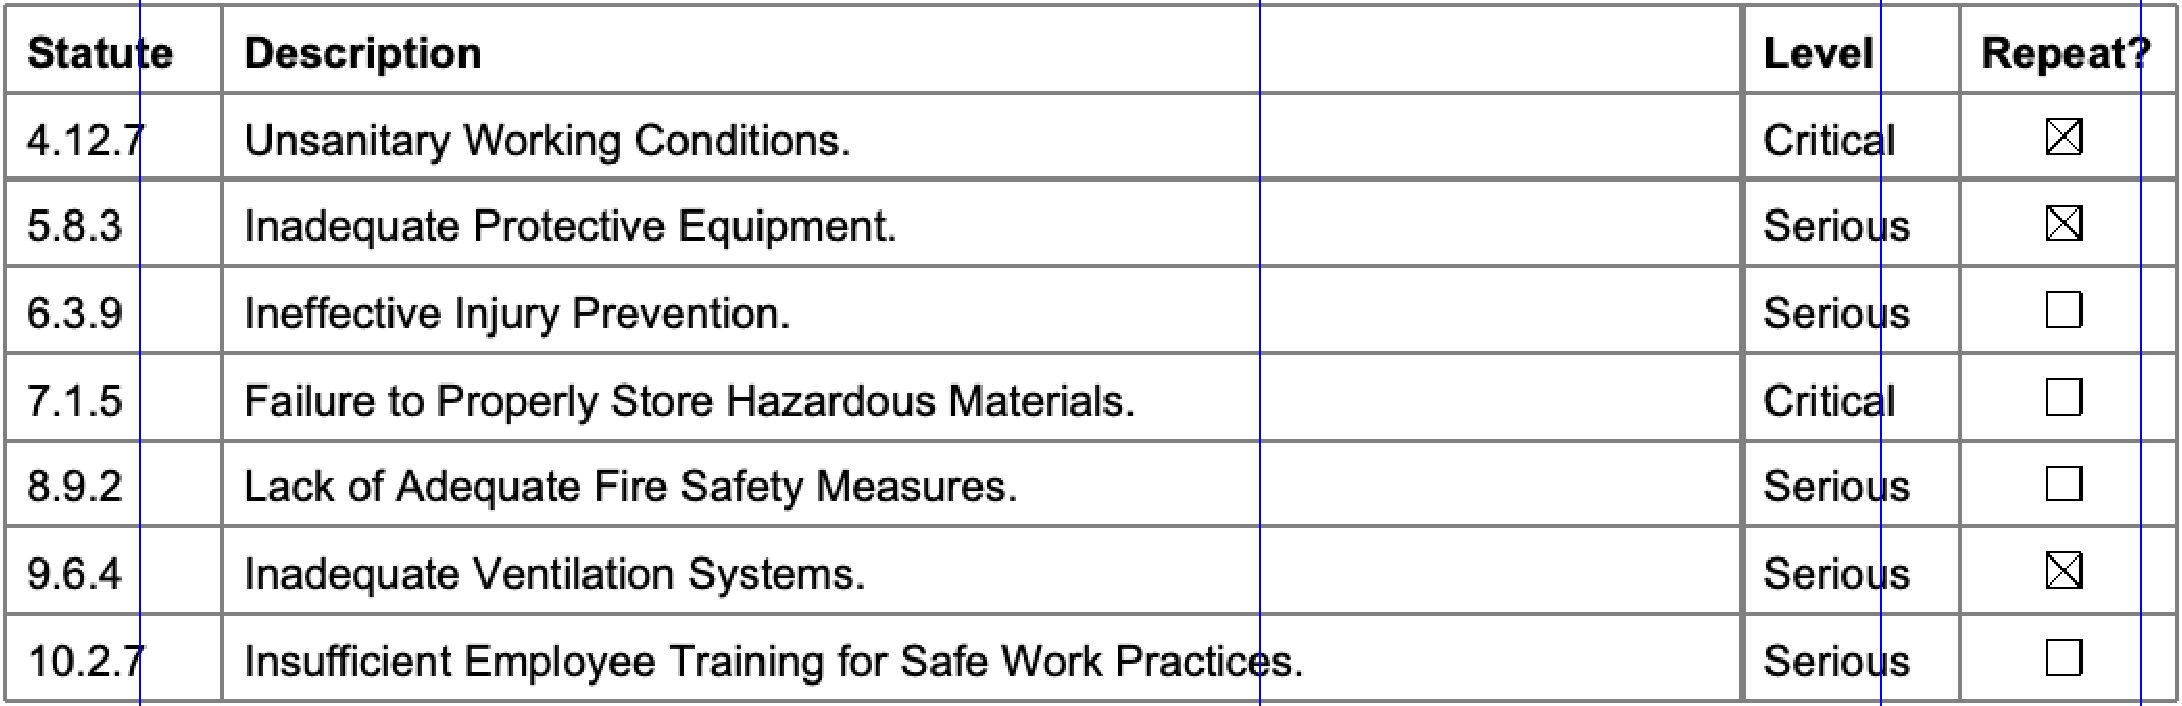
Look before extracting — that’s the whole point of guides. The boundaries landed on the text: one runs through the middle of “Statute”, another clips the longest description line, a third cuts through the Level column.
Snap to whitespace. Migrate each boundary to the nearest empty vertical channel:
guides.snap_to_whitespace()guides.show()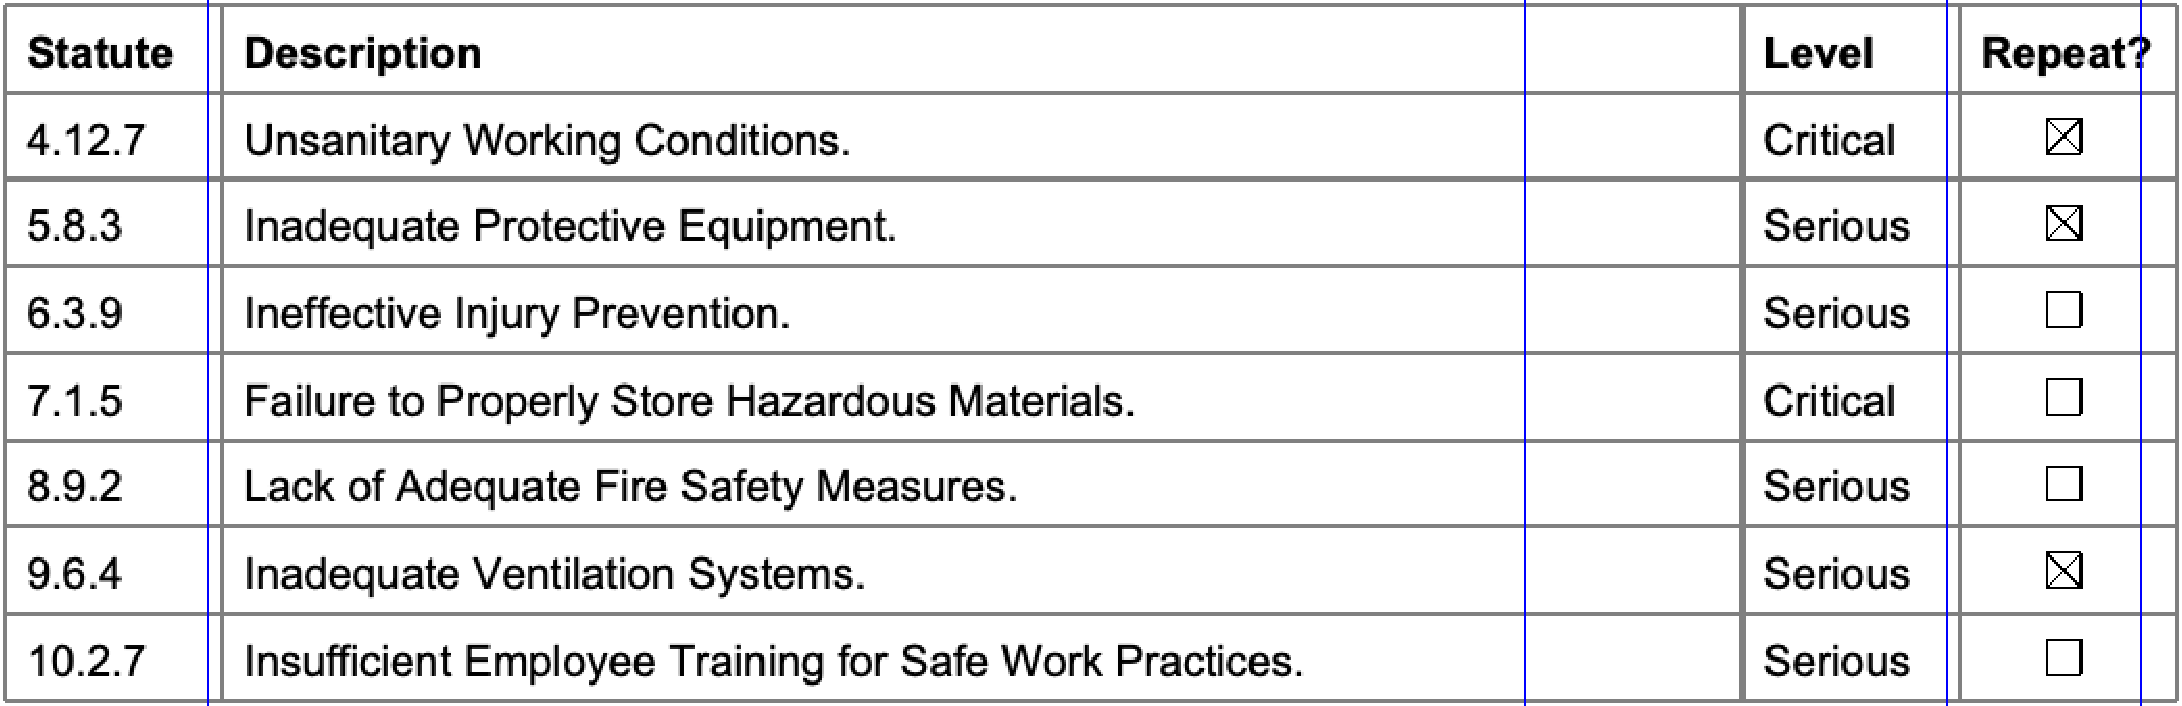
Rows from content. No horizontal lines to detect, but the first column is dependable — one statute number per row. Use those elements as row anchors:
anchors = guides.column(0).find_all('text')guides.horizontal.from_content(anchors)guides.show()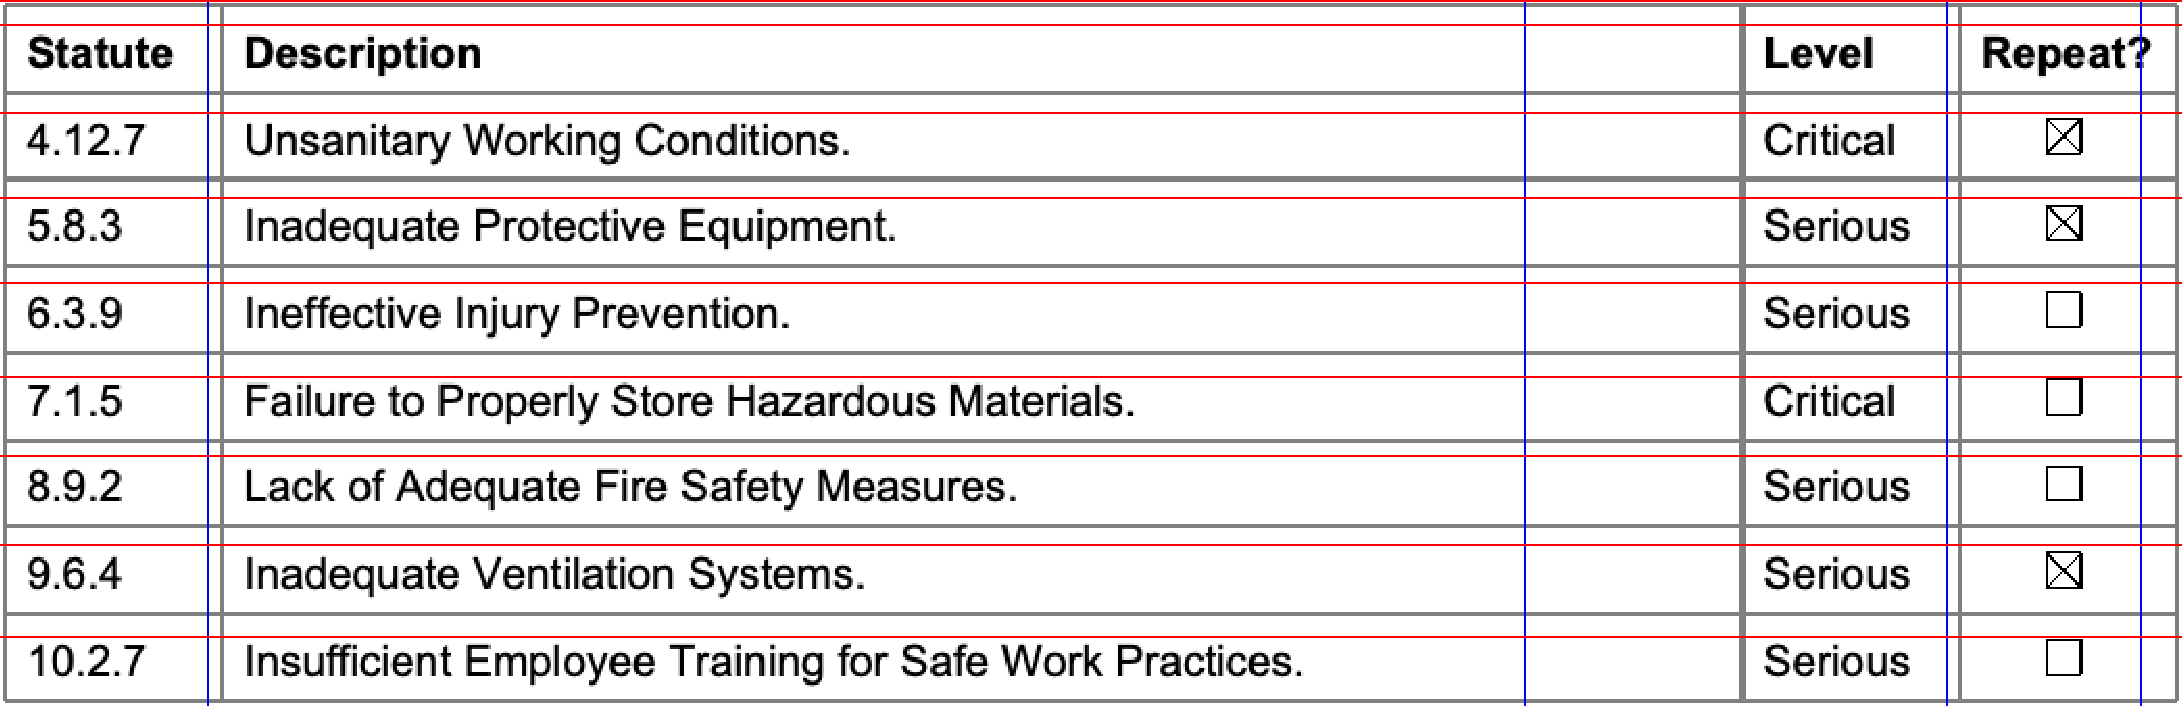
A full grid, built from headers, whitespace, and a reliable column — three kinds of evidence, none of them ruling lines. One last gap before extracting: the Repeat? column is drawn checkboxes, which OCR can’t read. This is the gap left open on the very first Learn page, and this is where it closes:
checkboxes = spage.detect_checkboxes()len(checkboxes)7guides.extract_table().to_df()| Statute | Description | Level | Repeat? | |
|---|---|---|---|---|
| 0 | 4.12.7 | Unsanitary Working Conditions. | Critical | [CHECKED] |
| 1 | 5.8.3 | Inadequate Protective Equipment. | Serious | [CHECKED] |
| 2 | 6.3.9 | Ineffective Injury Prevention. | Serious | [UNCHECKED] |
| 3 | 7.1.5 | Failure to Properly Store Hazardous Materials.. | Critical | [UNCHECKED] |
| 4 | 8.9.2 | Lack of Adequate Fire Safety Measures. | Serious | [UNCHECKED] |
| 5 | 9.6.4 | Inadequate Ventilation Systems. | Serious | [CHECKED] |
| 6 | 10.2.7 | Insufficient Employee Training for Safe Work P... | Serious | [UNCHECKED] |
Statutes, descriptions, levels, and real [CHECKED] / [UNCHECKED] states — from a page that started as pixels.
The punchline. That ladder was the general method, and it works when a table has no lines at all. This table, though, does have visible lines — they’re just pixels, not vector graphics. from_lines(detection_method='pixels') scans the rendered image for dark runs, and the whole grid takes three lines:
guides = table_area.guides()guides.vertical.from_lines(detection_method='pixels')guides.horizontal.from_lines(detection_method='pixels')guides.show()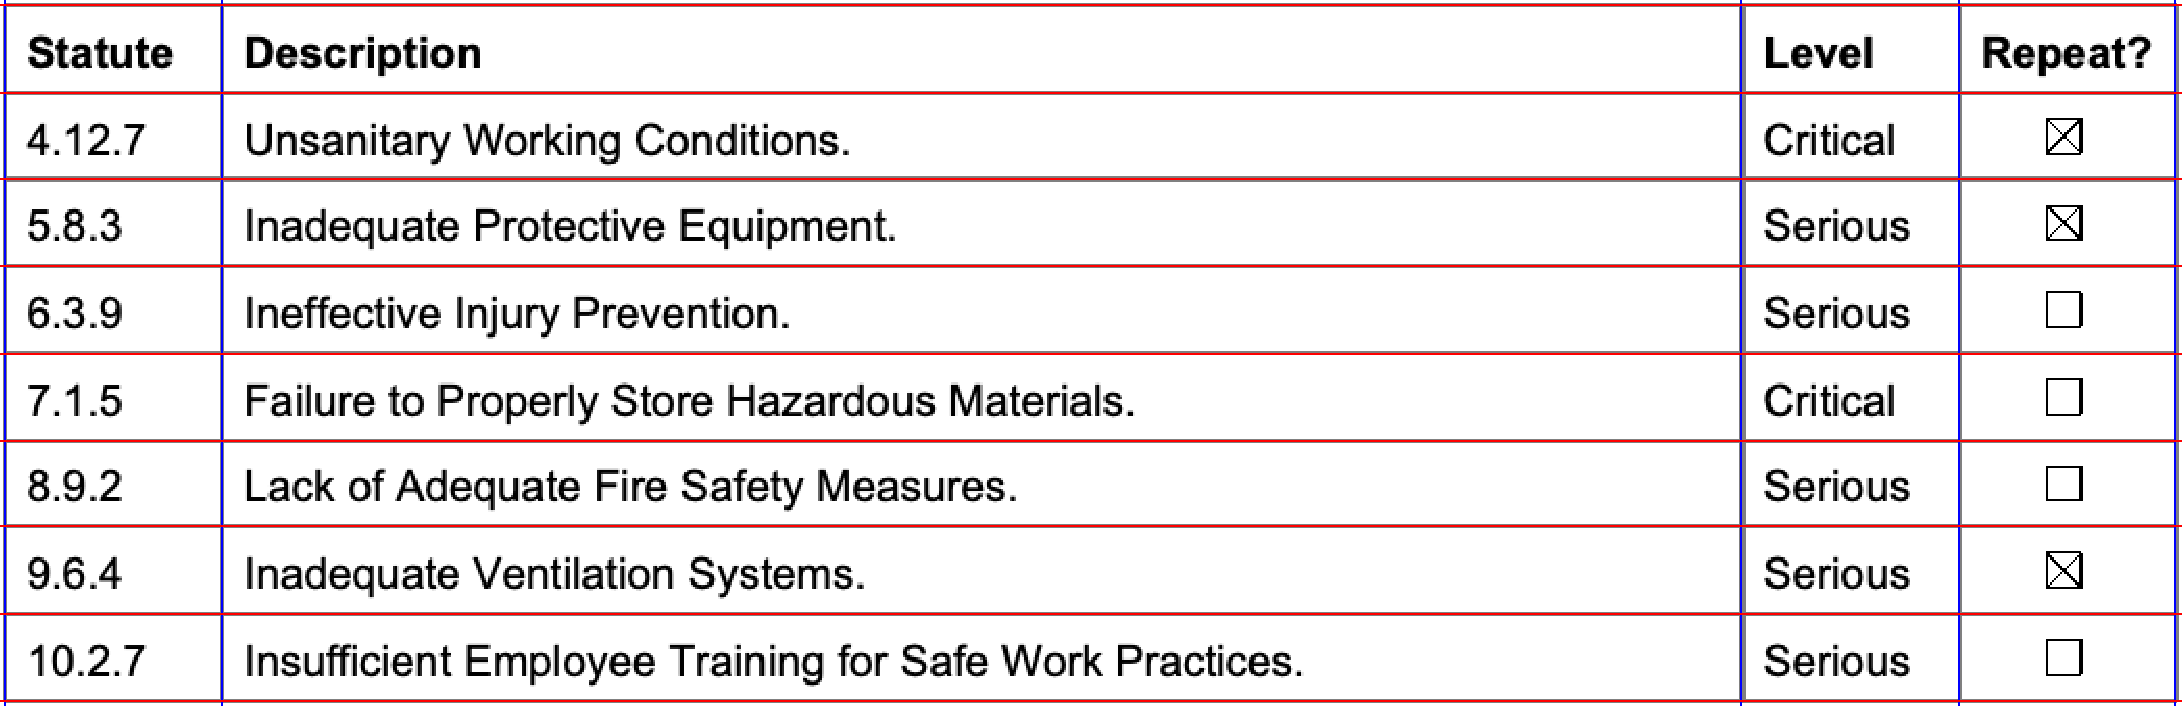
guides.extract_table().to_df()| Statute | Description | Level | Repeat? | |
|---|---|---|---|---|
| 0 | 4.12.7 | Unsanitary Working Conditions. | Critical | [CHECKED] |
| 1 | 5.8.3 | Inadequate Protective Equipment. | Serious | [CHECKED] |
| 2 | 6.3.9 | Ineffective Injury Prevention. | Serious | [UNCHECKED] |
| 3 | 7.1.5 | Failure to Properly Store Hazardous Materials.. | Critical | [UNCHECKED] |
| 4 | 8.9.2 | Lack of Adequate Fire Safety Measures. | Serious | [UNCHECKED] |
| 5 | 9.6.4 | Inadequate Ventilation Systems. | Serious | [CHECKED] |
| 6 | 10.2.7 | Insufficient Employee Training for Safe Work P... | Serious | [UNCHECKED] |
Same DataFrame. The craft is matching the tool to the evidence: pixel lines when the rulings are visible, headers + whitespace + content anchors when they aren’t, and guides.show() at every step, because a wrong grid produces a plausible wrong table.
That’s the method. The rest of this page is the toolbox — what each guide source actually does, the parameters that matter, and what to reach for when the first attempt gives you a wrong grid.
Ruled tables: when the lines are vectors
Section titled “Ruled tables: when the lines are vectors”The scan’s rulings were pixels. In a born-digital PDF the rulings are usually vector graphics — real line elements with exact coordinates — and from_lines() reads them directly, no rendering involved. This equipment log has a fully drawn grid:
ruled = PDF("pdfs/guides-ruled-sample.pdf")rpage = ruled.pages[0]rpage.show()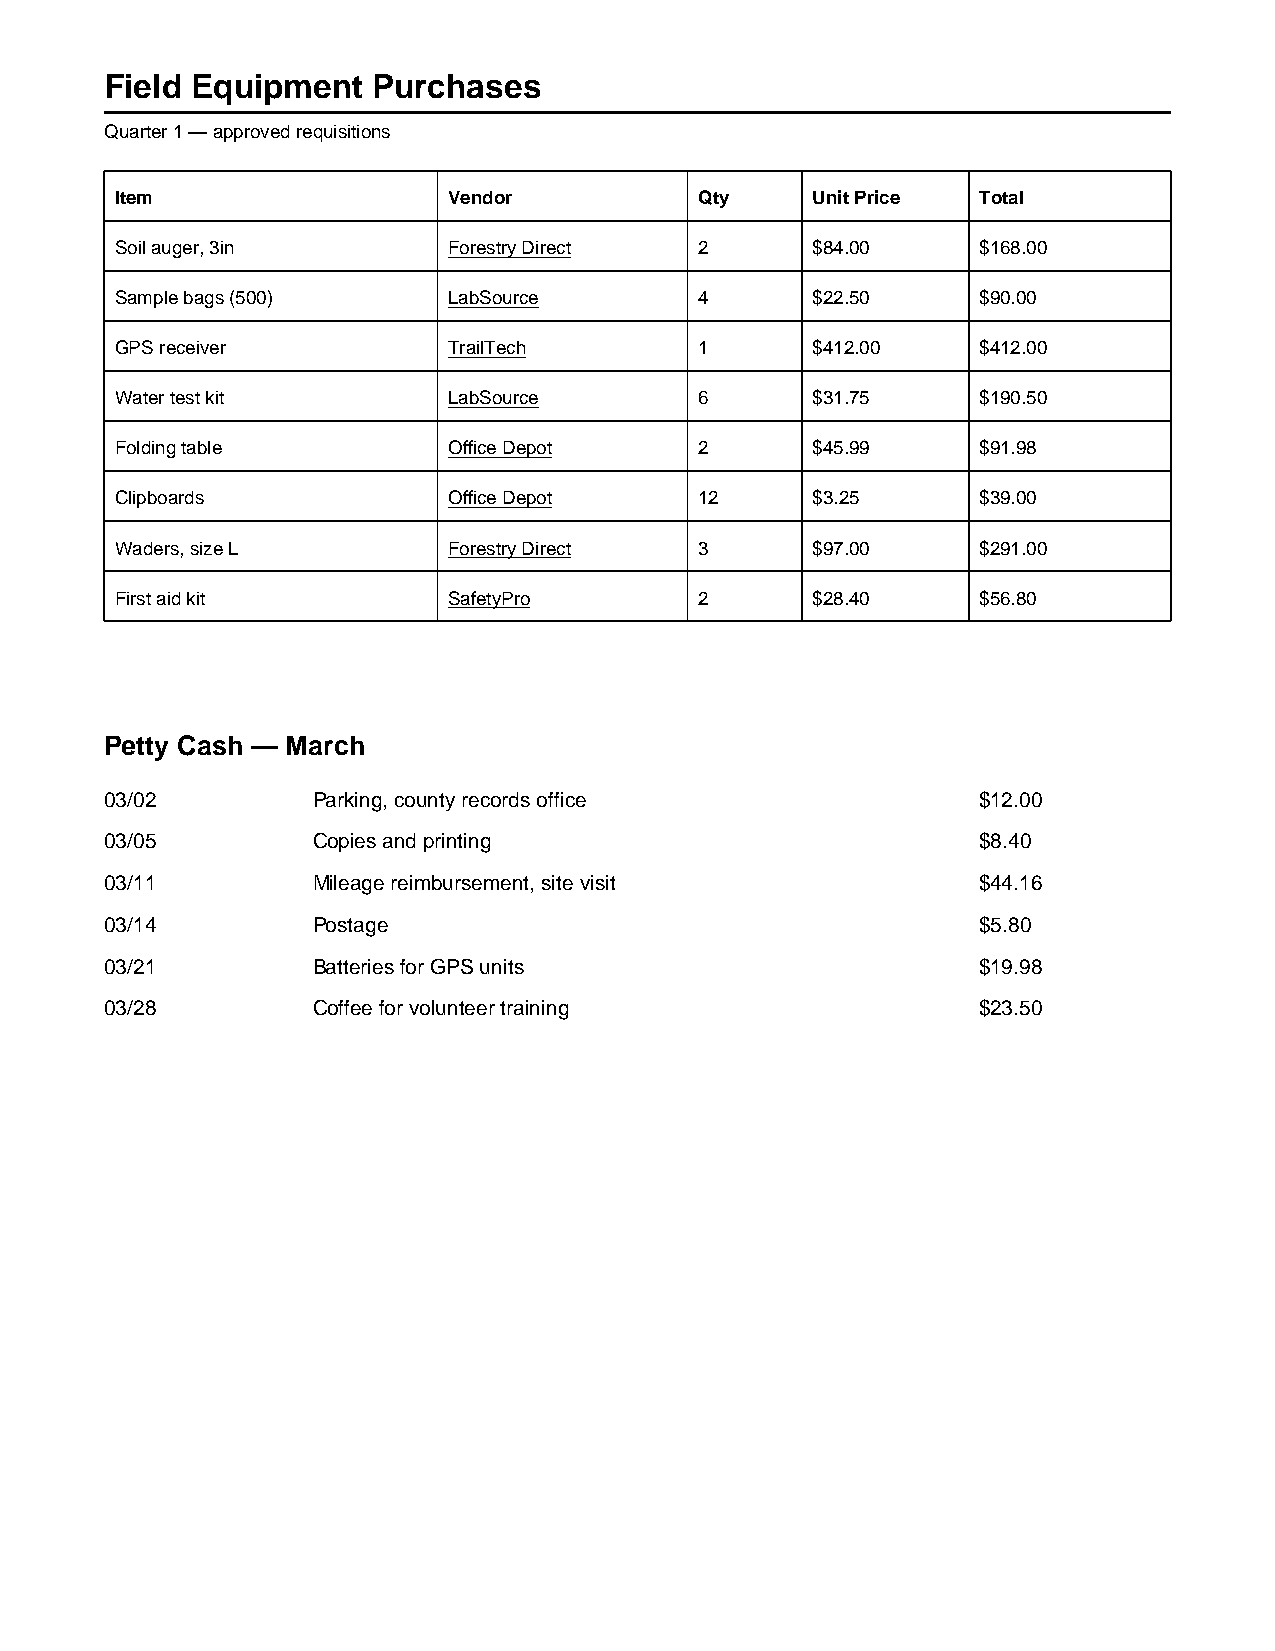
Anchor the table area first — the decorative rule under the title is also a line element, and scoping the region keeps it out of the evidence. Then look at the evidence itself:
equip = ( rpage .find('text:contains("approved requisitions")') .below(until='text:contains("Petty Cash")', include_endpoint=False))equip.find_all('line').show(crop=True)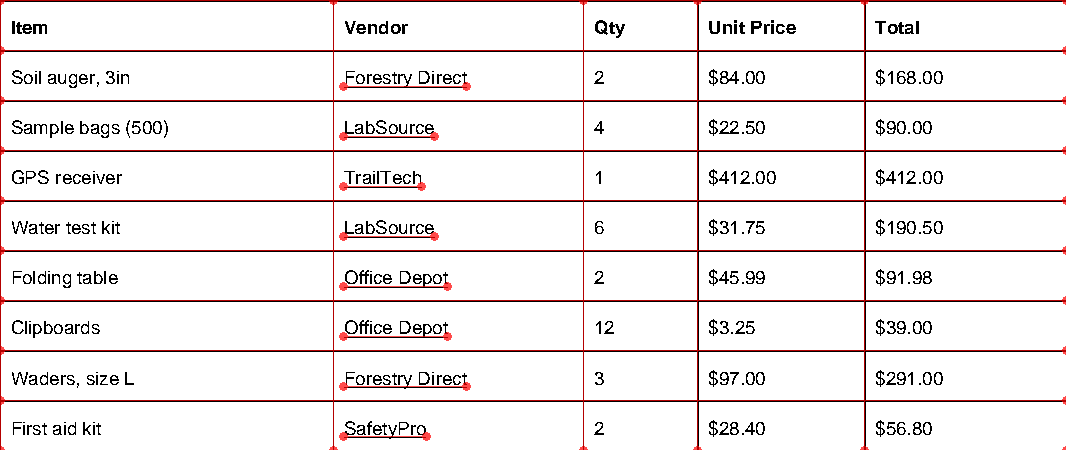
Every line element in the region: the grid — plus a short underline beneath each vendor name. Vector detection turns each one into a guide:
g = equip.guides()g.vertical.from_lines(detection_method='vector')g.horizontal.from_lines(detection_method='vector')g.show()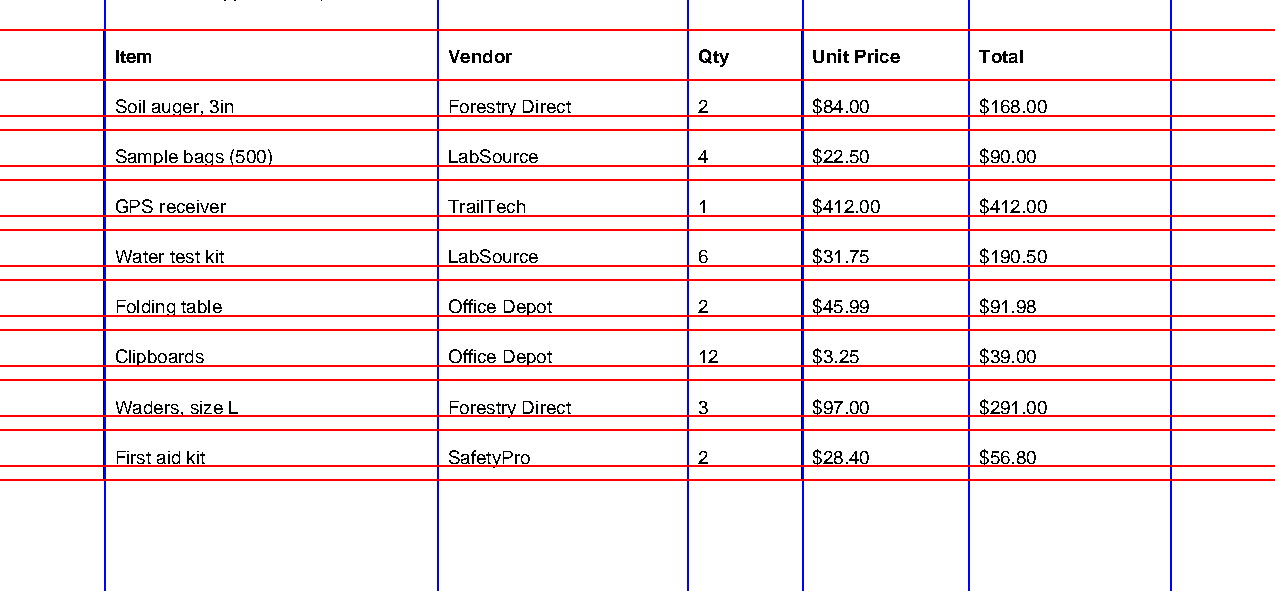
The columns are perfect. The rows are doubled — every underline became a phantom row boundary a few points above the real ruling:
g.extract_table().to_df()| Item | Vendor | Qty | Unit Price | Total | |
|---|---|---|---|---|---|
| 0 | Soil auger, 3in | Forestry Direct | 2 | $84.00 | $168.00 |
| 1 | None | None | None | None | None |
| 2 | Sample bags (500) | LabSource | 4 | $22.50 | $90.00 |
| 3 | None | None | None | None | None |
| 4 | GPS receiver | TrailTech | 1 | $412.00 | $412.00 |
| 5 | None | None | None | None | None |
| 6 | Water test kit | LabSource | 6 | $31.75 | $190.50 |
| 7 | None | None | None | None | None |
| 8 | Folding table | Office Depot | 2 | $45.99 | $91.98 |
| 9 | None | None | None | None | None |
| 10 | Clipboards | Office Depot | 12 | $3.25 | $39.00 |
| 11 | None | None | None | None | None |
| 12 | Waders, size L | Forestry Direct | 3 | $97.00 | $291.00 |
| 13 | None | None | None | None | None |
| 14 | First aid kit | SafetyPro | 2 | $28.40 | $56.80 |
| 15 | None | None | None | None | None |
Every other row is an empty sliver. The fix is to count what you trust: nine rows of table means ten rulings, and n=10 keeps only the ten longest detected lines — the full-width rulings win, the short underlines lose:
g.horizontal.from_lines(detection_method='vector', n=10)g.show()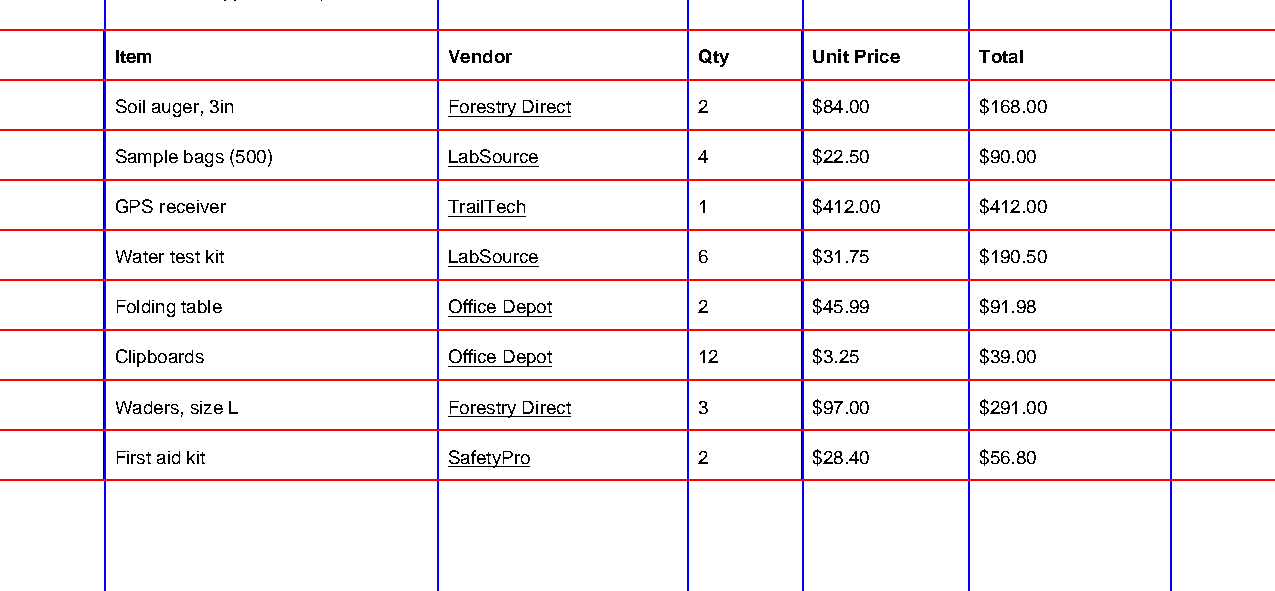
g.extract_table().to_df()| Item | Vendor | Qty | Unit Price | Total | |
|---|---|---|---|---|---|
| 0 | Soil auger, 3in | Forestry Direct | 2 | $84.00 | $168.00 |
| 1 | Sample bags (500) | LabSource | 4 | $22.50 | $90.00 |
| 2 | GPS receiver | TrailTech | 1 | $412.00 | $412.00 |
| 3 | Water test kit | LabSource | 6 | $31.75 | $190.50 |
| 4 | Folding table | Office Depot | 2 | $45.99 | $91.98 |
| 5 | Clipboards | Office Depot | 12 | $3.25 | $39.00 |
| 6 | Waders, size L | Forestry Direct | 3 | $97.00 | $291.00 |
| 7 | First aid kit | SafetyPro | 2 | $28.40 | $56.80 |
Two things worth knowing about from_lines. The default detection_method='auto' uses vector lines when the page has line elements and falls back to pixels when it doesn’t — and warns you which one it picked; passing 'vector' or 'pixels' explicitly makes the choice yours. And threshold does nothing in vector mode: a line element either exists or it doesn’t. If the junk lines aren’t shorter than the real ones, n will keep the wrong ones — that’s a job for remove_at(), further down.
Pixel detection: the knobs that matter
Section titled “Pixel detection: the knobs that matter”The punchline above made detection_method='pixels' look effortless, but it worked because of where it ran. Run the identical call on the whole scanned page instead of the anchored table:
gpage = spage.guides()gpage.vertical.from_lines(detection_method='pixels')gpage.horizontal.from_lines(detection_method='pixels')gpage.show()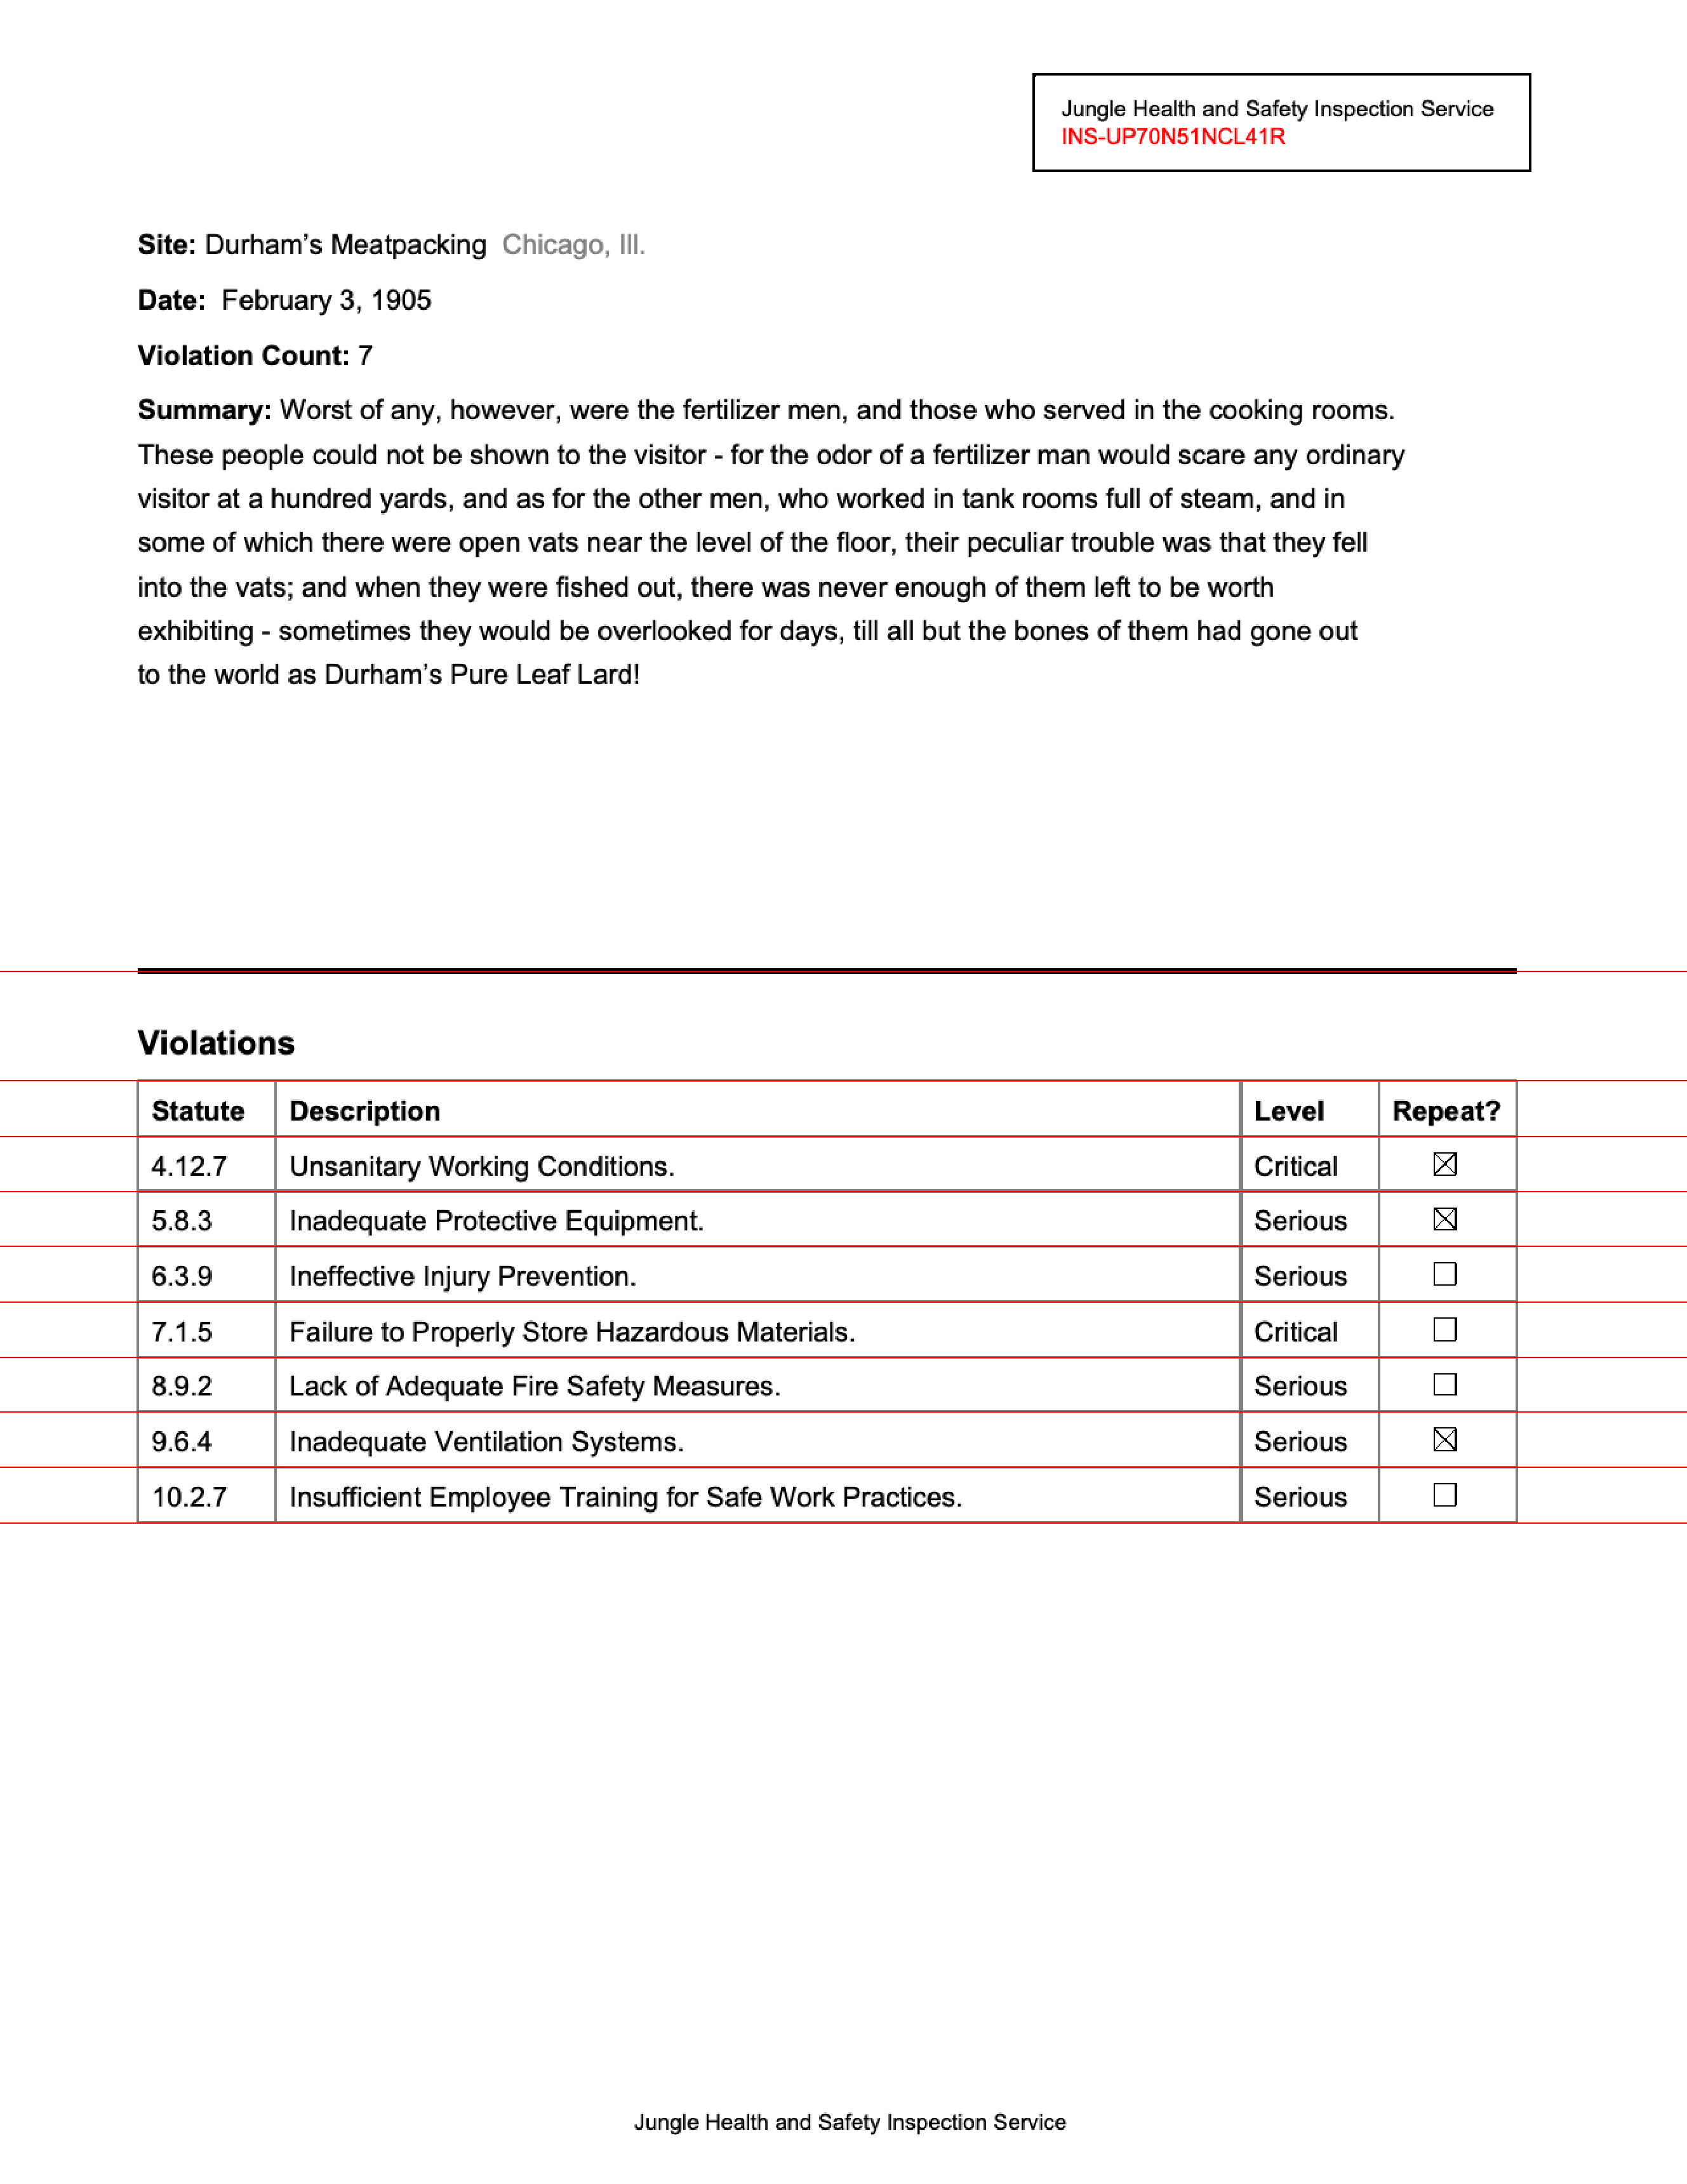
The row rulings show up. The column rulings don’t — not one. Here’s why: pixel detection renders the region (at resolution=192 dpi) and looks for pixel rows and columns that are dark across at least threshold of the region’s width or height — 'auto' means half. The table’s vertical rulings span well under half the page’s height, so they never clear the bar. Lower the bar and they appear:
gpage.vertical.from_lines(detection_method='pixels', threshold=0.2)gpage.horizontal.from_lines(detection_method='pixels', threshold=0.2)gpage.show()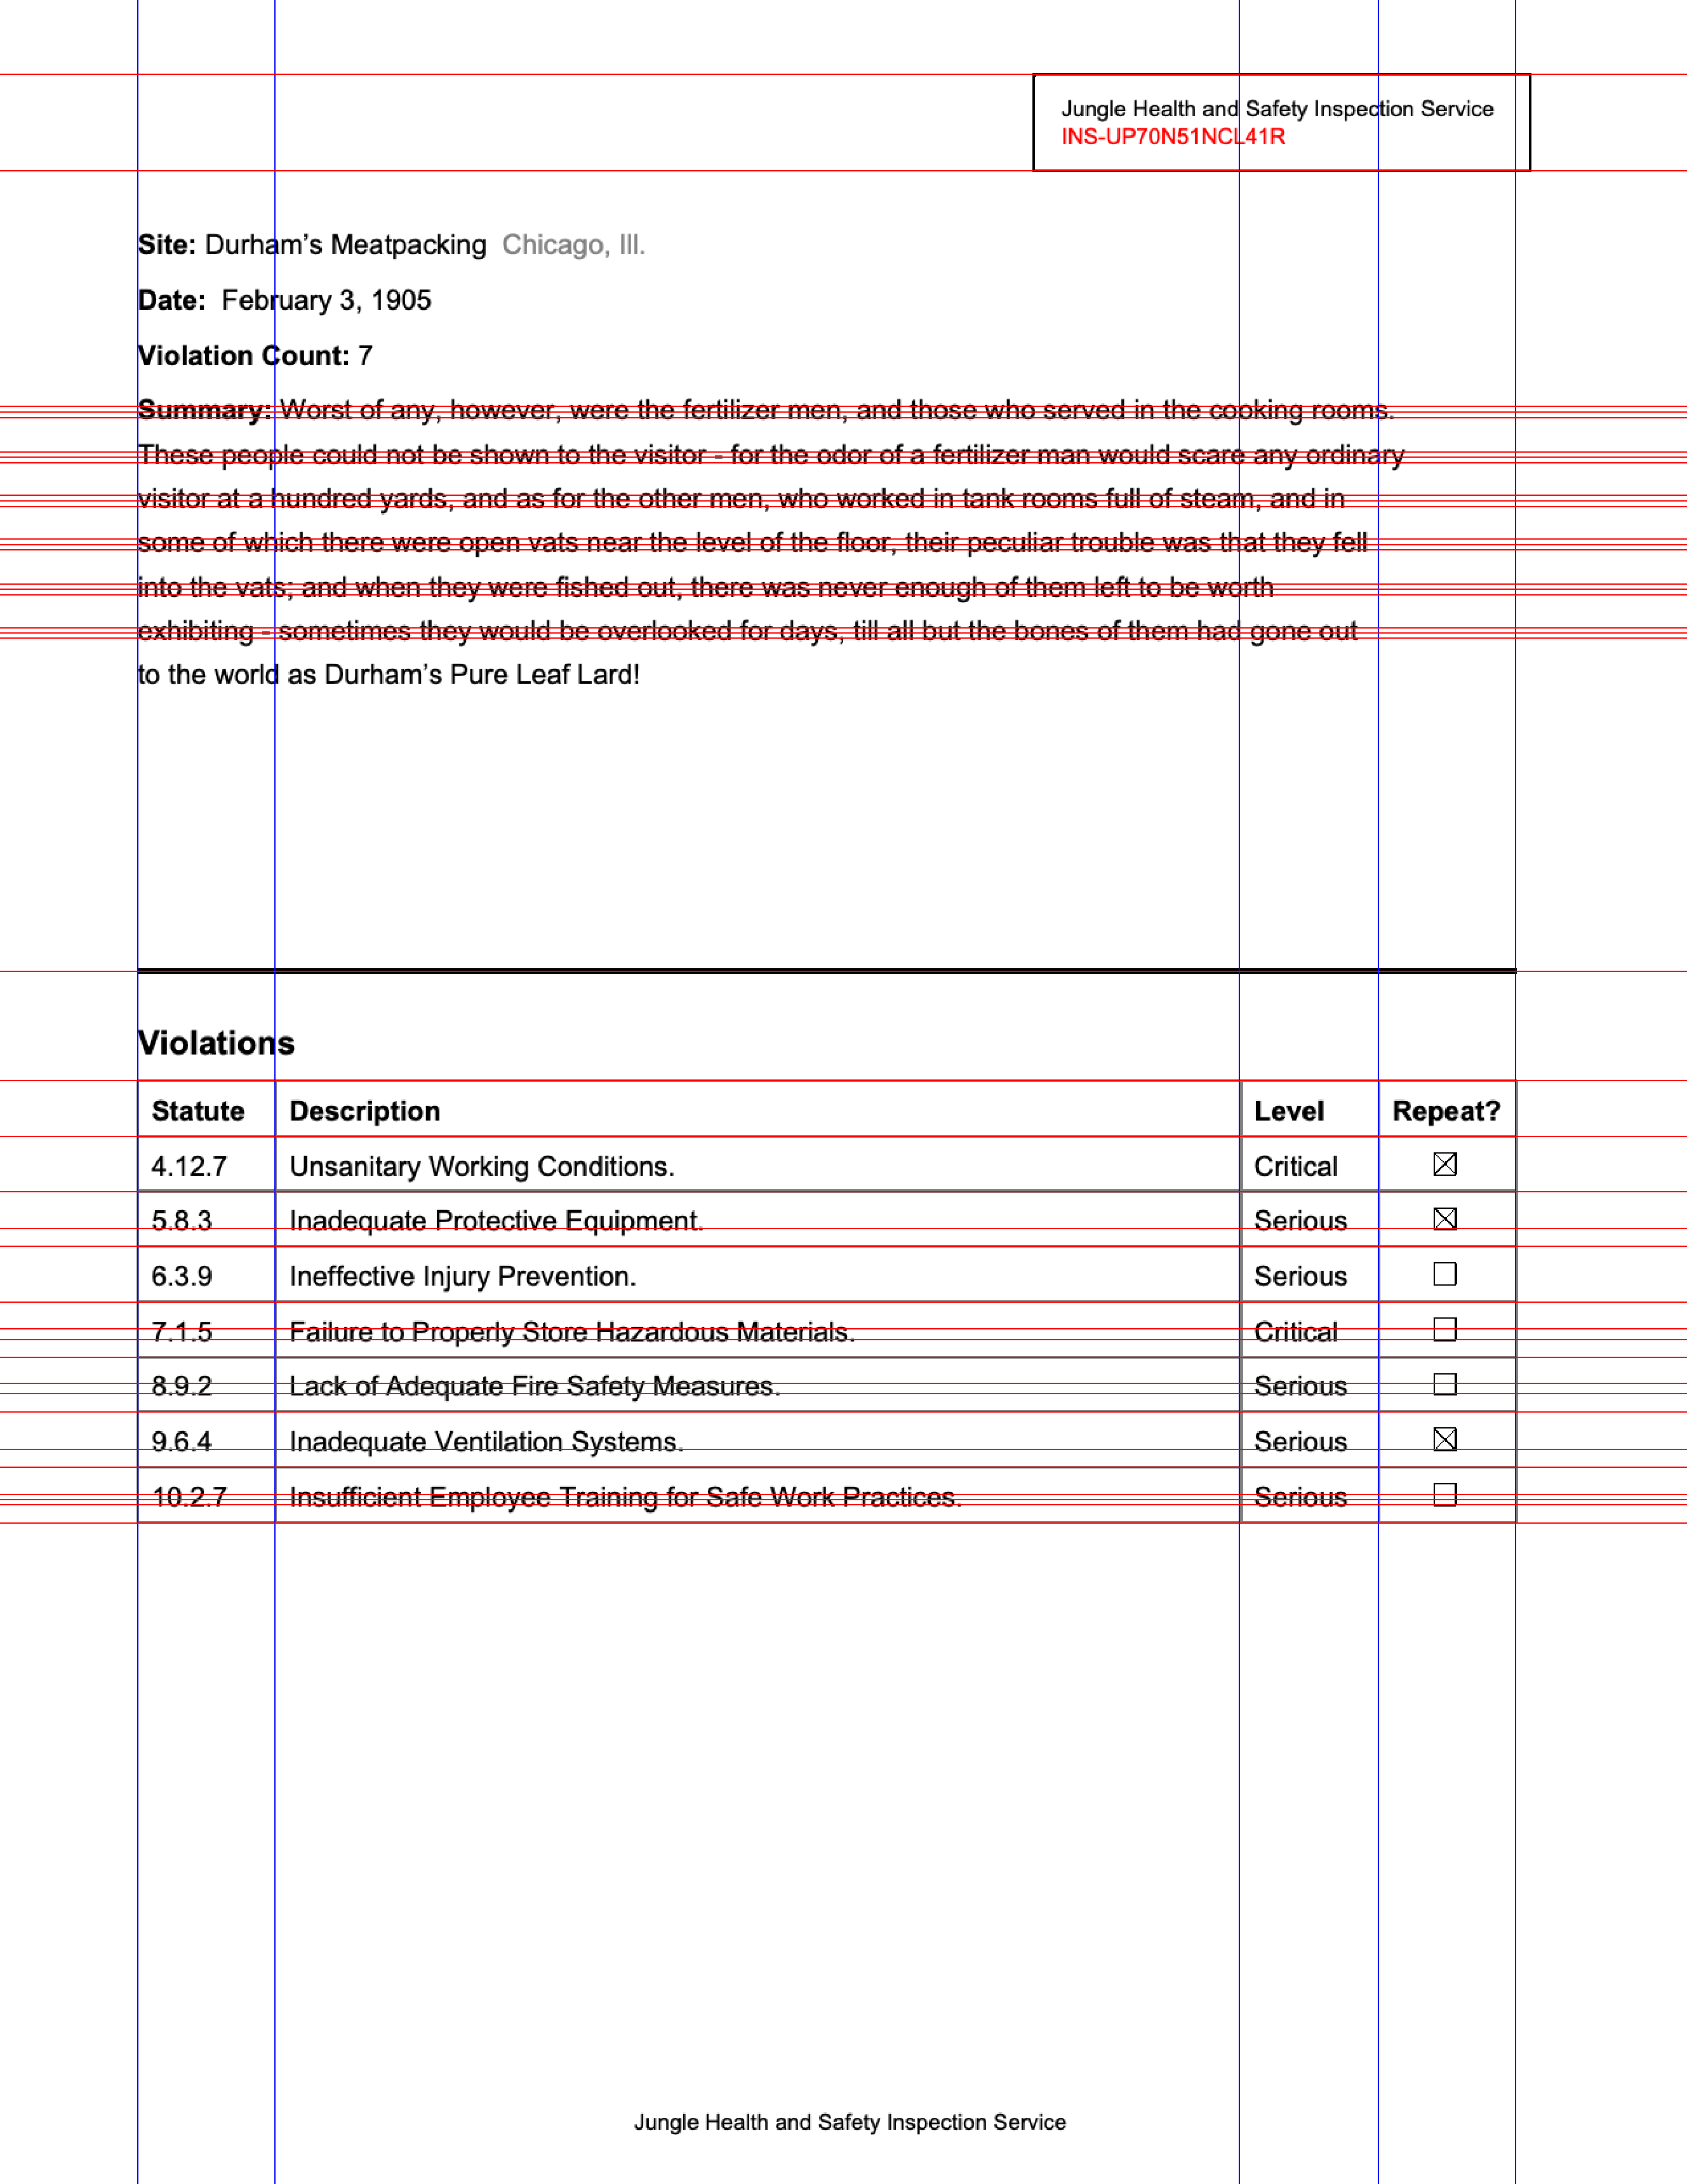
The verticals are right — and the horizontals are ruined, because every line of paragraph text is dark across 20% of the page’s width too. Each axis is its own call, so give each axis its own threshold:
gpage.vertical.from_lines(detection_method='pixels', threshold=0.2)gpage.horizontal.from_lines(detection_method='pixels')gpage.show()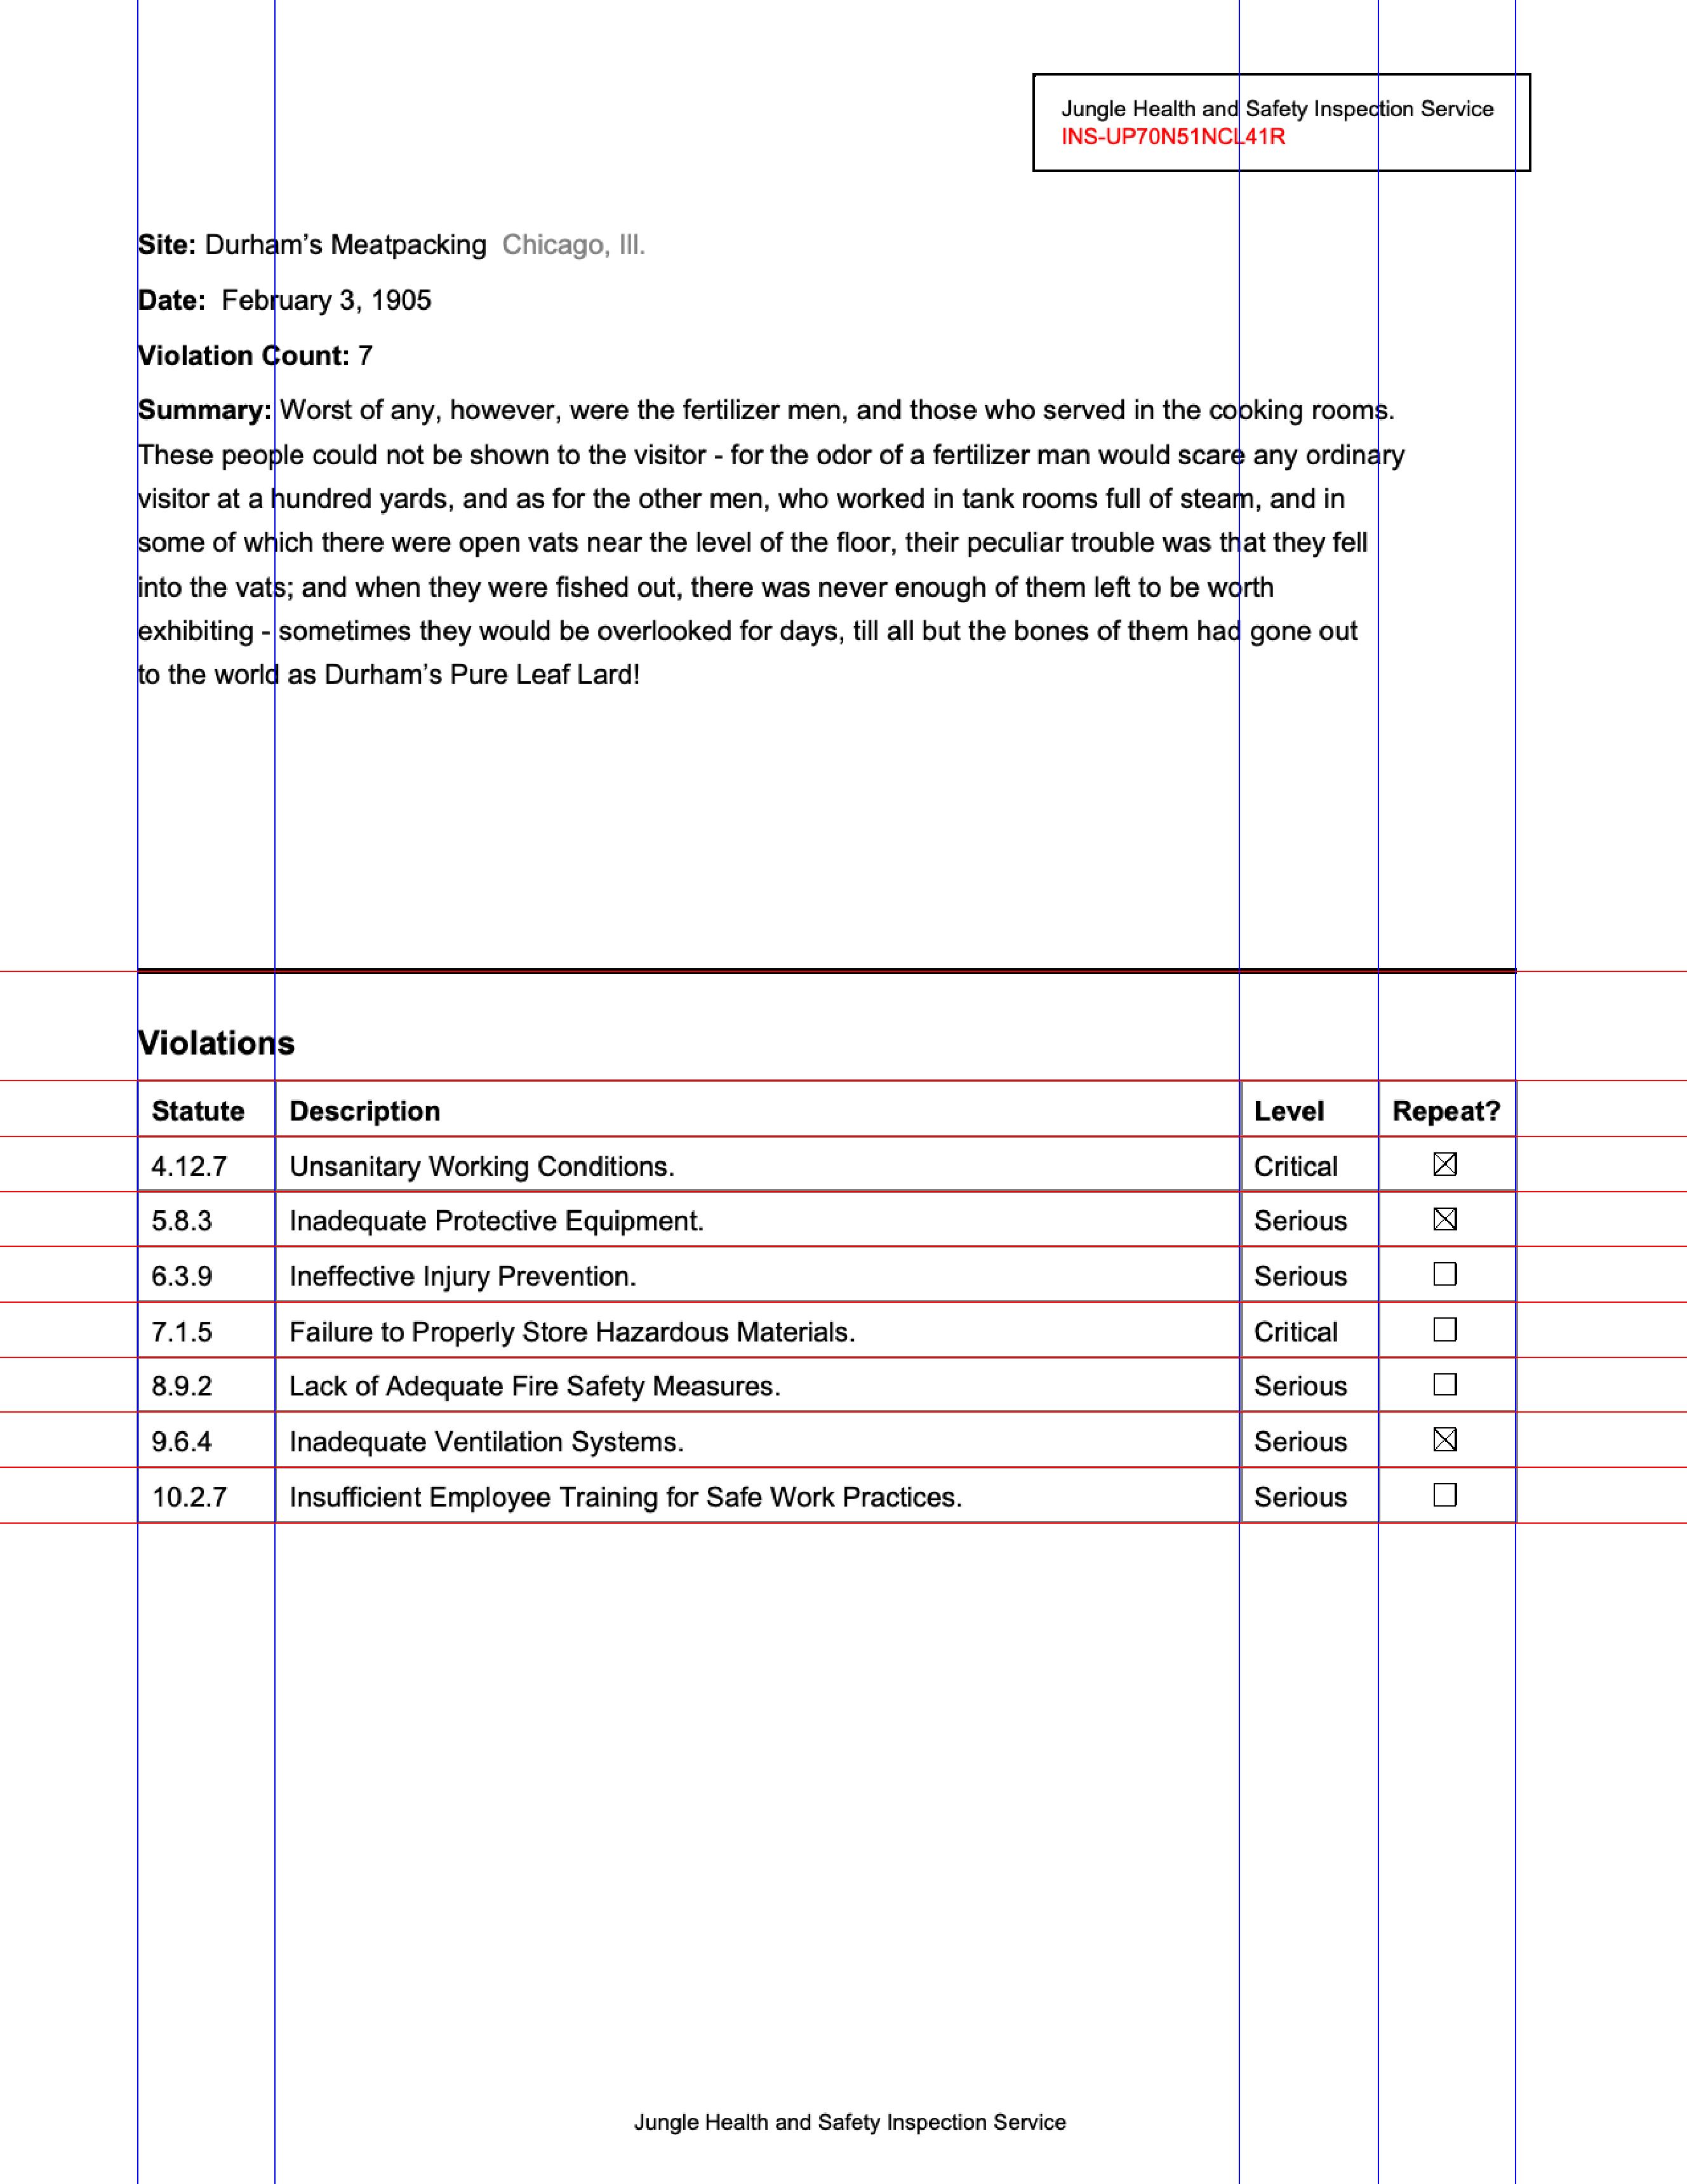
One more knob: min_gap, the minimum spacing (in pixels, at that same resolution) between detected lines. At threshold=0.2 the horizontal pass finds many of the same fuzzy lines two or three times over, a few pixels apart:
messy = spage.guides()messy.horizontal.from_lines(detection_method='pixels', threshold=0.2)len(messy.horizontal)39messy.horizontal.from_lines(detection_method='pixels', threshold=0.2, min_gap=30)len(messy.horizontal)23The near-duplicates collapse — but every text row survives, because min_gap merges detections, it doesn’t judge them. Which points at the real lesson: the best fix for messy pixel detection is usually a smaller region, not a better parameter. Inside table_area the rulings span the full region, the default threshold clears easily, and the punchline took three lines. Shrink the region first; reach for the knobs when you can’t.
No lines at all: columns from whitespace
Section titled “No lines at all: columns from whitespace”The equipment page has a second block with no evidence to detect — no rulings, no headers, just three columns separated by gaps:
petty = rpage.find('text:contains("Petty Cash")').below().trim()petty.show(crop=True)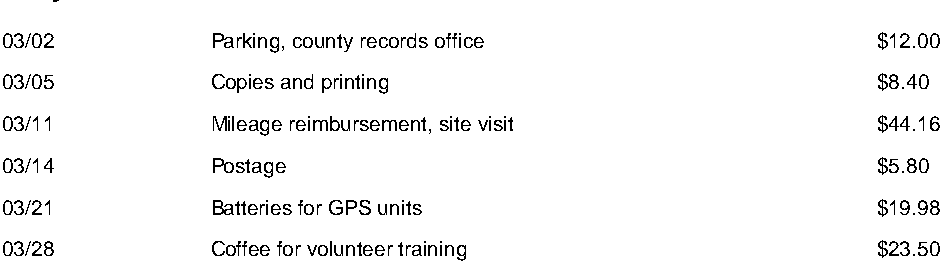
from_whitespace() puts the boundaries in the gaps:
gp = petty.guides()gp.vertical.from_whitespace(min_gap=10)gp.show()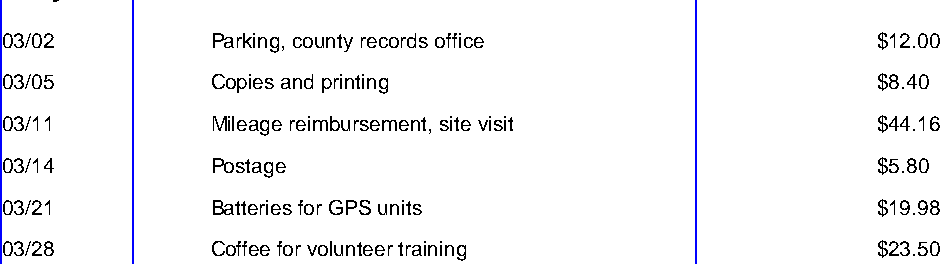
Three clean columns. Know what it’s doing under the hood, though: it splits the region evenly three ways, then snaps each boundary into the nearest text gap that’s at least min_gap points wide. Three columns is all it ever proposes — it fit here because this is a three-column table. For any other shape, build the same thing yourself from its two parts, divide() and snap_to_whitespace() — which are worth knowing separately anyway.
Manual control: divide, then tweezers
Section titled “Manual control: divide, then tweezers”divide(n=3) is the blind half of the recipe: evenly spaced boundaries, outer edges included, no evidence consulted —
gm = petty.guides()gm.vertical.divide(n=3)gm.show()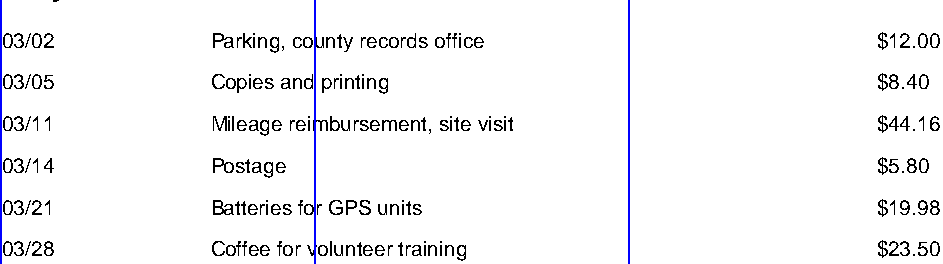
— and it shows. One boundary cuts straight through the descriptions, the other floats in a gap. When only a boundary or two is wrong, you don’t need a better detector, you need tweezers: shift(i, offset) nudges one guide, remove_at(i) deletes one, add(x) inserts one. And you don’t have to guess coordinates — read them off an element:
gm.vertical.shift(1, -60) # nudge the date boundary into the gapamount_x = petty.find('text:contains("$")').x0 # where the amounts startgm.vertical.remove_at(2) # drop the boundary stuck mid-descriptiongm.vertical.add(amount_x - 5) # place one just left of the amountsgm.show()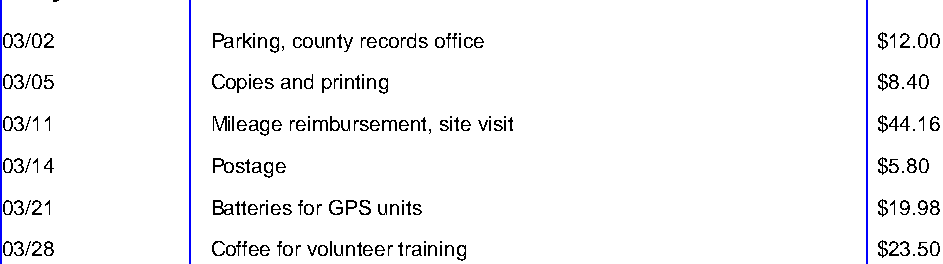
guides.columns[i] and guides.rows[i] hand back each strip as a Region, so you can check one column before trusting the whole grid:
gm.columns[2].extract_text()'$12.00\n$8.40\n$44.16\n$5.80\n$19.98\n$23.50'Snapping: let the evidence move the guides
Section titled “Snapping: let the evidence move the guides”Hand-fixing scales badly past a couple of boundaries. Snapping is the same repair done by evidence: start from a blind split and let the layout pull each guide into place. First look at what the guides will be snapping between — the word boxes and the gaps around them:
petty.find_all('text').show(crop=True)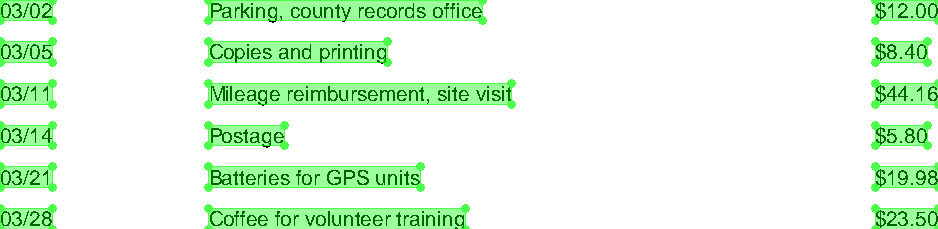
snap_to_whitespace() migrates each guide to the nearest gap at least min_gap points wide (its detection_method can weigh rendered 'pixels' or text element positions, 'text'; on_no_snap controls whether a guide that finds no gap warns, raises, or stays put):
gs = petty.guides()gs.vertical.divide(n=3)gs.vertical.snap_to_whitespace()gs.show()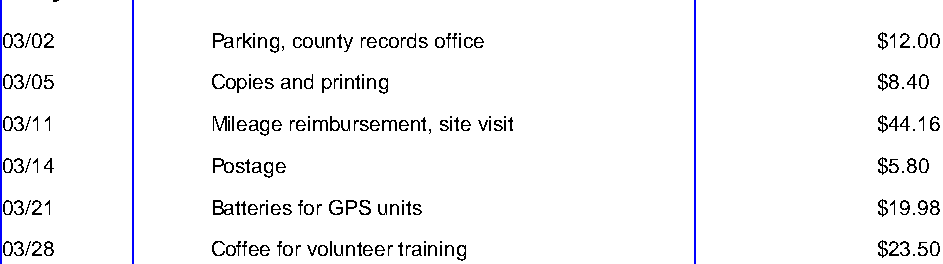
Both misplaced boundaries found their gaps. A gap is a range, though, and the guide lands somewhere inside it. When you want a boundary flush against a known column instead, snap_to_content() pulls the guide nearest each marker onto that element’s edge:
gs.vertical.snap_to_content(markers=['Parking'], align='left', tolerance=50)gs.show()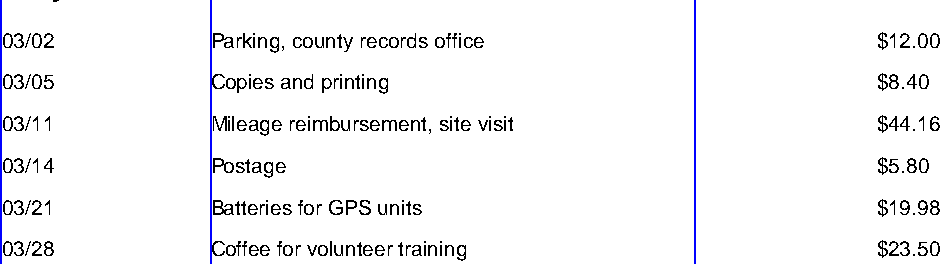
The middle boundary now sits exactly on the description column’s left edge. tolerance is the maximum distance a guide may travel — and it’s your safety rail: each marker moves whichever guide is currently closest to it, so a generous tolerance can drag a boundary you never meant to touch (including an outer edge). Keep it barely bigger than the move you intend.
Rows, same as the scan walkthrough: one date per row makes the dates perfect anchors. Show the anchors, then build from them:
dates = petty.find_all('text:contains("03/")')dates.show(crop=petty)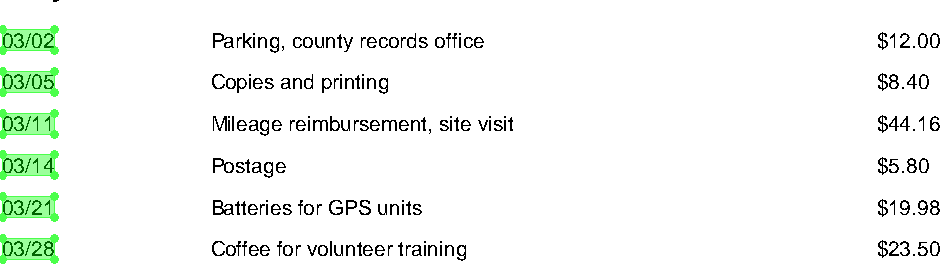
gs.horizontal.from_content(dates, align='top', outer=True)gs.show()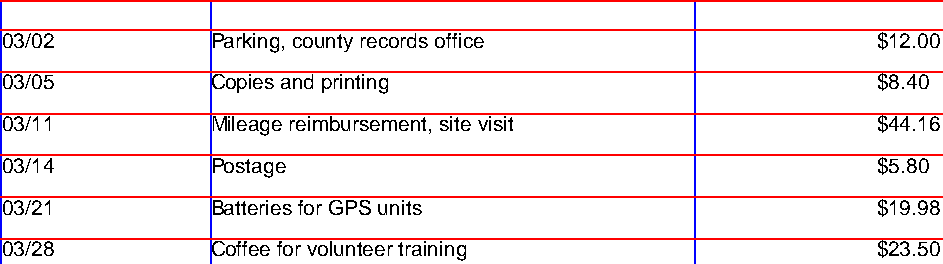
gs.extract_table().to_df(header=False)| 0 | 1 | 2 | |
|---|---|---|---|
| 0 | 03/02 | Parking, county records office | $12.00 |
| 1 | 03/05 | Copies and printing | $8.40 |
| 2 | 03/11 | Mileage reimbursement, site visit | $44.16 |
| 3 | 03/14 | Postage | $5.80 |
| 4 | 03/21 | Batteries for GPS units | $19.98 |
| 5 | 03/28 | Coffee for volunteer training | $23.50 |
A table with no lines and no headers, extracted three different ways — from_whitespace when three columns is what you have, tweezers when one boundary is wrong, divide-and-snap for everything else.
What you can do now
Section titled “What you can do now”Build table grids from whatever evidence a page offers — vector rulings (from_lines, with n to keep only the lines you trust), pixel rulings (threshold, min_gap, and above all a tightly scoped region), headers, whitespace gaps, or content anchors — and fix the grid when detection isn’t enough: divide for known counts, shift/add/remove_at for one bad boundary, snap_to_whitespace and snap_to_content to let the layout pull guides into place. Check each step with guides.show(), because a wrong grid produces a plausible wrong table, and read drawn checkboxes with detect_checkboxes(). The last page puts the whole toolkit on one real document, start to finish.